

Memo — quality analytics
Champion model unchanged. AUC flat. False rejects down. Then escapes tick up and nobody can explain why the hold queue emptied.
The line got cleaner. Base defect rate fell from 1.8% to 0.4% after a fixture and lighting MoC. The model still outputs logits trained on the old prevalence. After the mix shift, uncalibrated scores sit below the cut that used to catch the same visual cues; thresholds tuned last quarter still “work” on precision charts built from stale weeks. Reviewers see fewer items because scores never cross the old cut—not because the model sees less risk.
This is not confusion-matrix theater, not active-learning queue bias, and not look-ahead joins. It is probability calibration vs. moving base rate.
What to plot weekly
- Reliability diagram: binned predicted probability vs. observed defect rate on production samples.
- Base-rate trend alongside threshold crossings.
- Count of manual audits per thousand units—should rise when prevalence falls if thresholds are fixed.
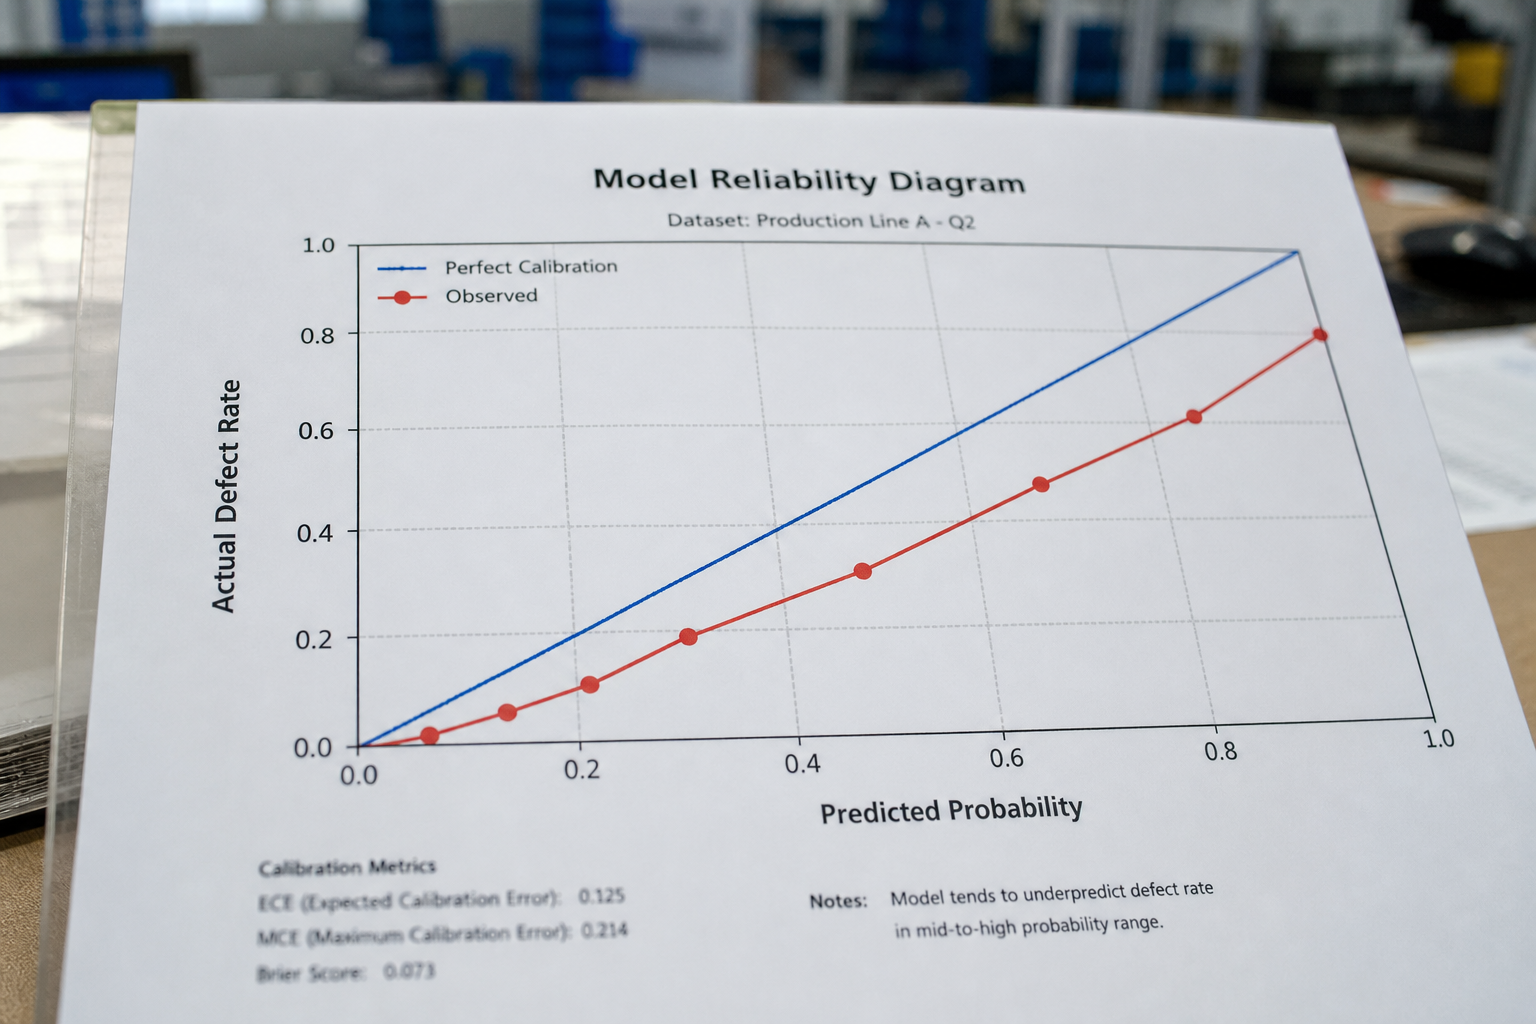
Gate before any threshold change
Recalibrate (Platt, isotonic, or your plant standard) on recent scored rows with verified labels. Document base-rate window. If you only move the threshold without calibration, you are guessing.
Decision: No threshold promotion without a calibration report dated after the last known base-rate shift.